Crowd Size Signals: Linking Attendance Data to Home Advantage in Betting Odds
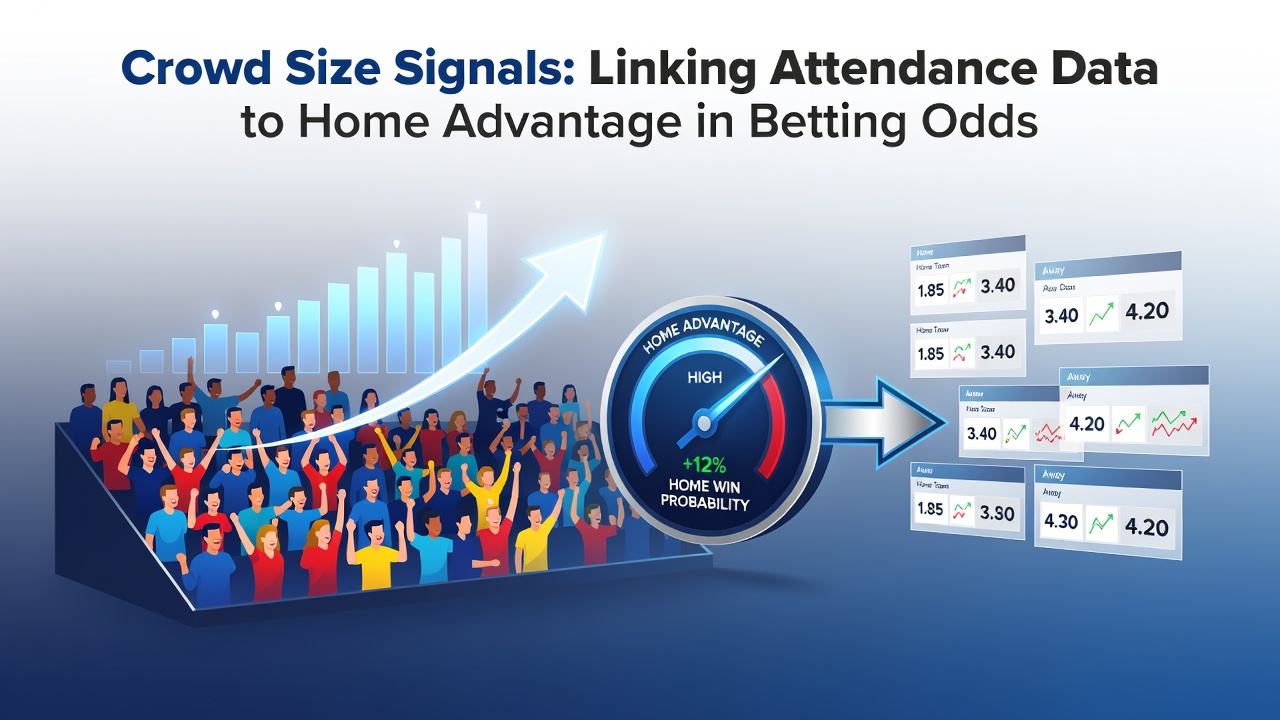
Attendance figures have long served as measurable indicators that shape home advantage calculations in football betting markets, with bookmakers adjusting odds based on historical patterns where larger crowds correlate to stronger team performances at home venues. Data from English leagues shows that average attendance above 30,000 spectators often aligns with reduced away win probabilities, while lower figures in the Championship and below frequently signal opportunities for value in draw or away selections. Researchers tracking these variables note consistent shifts in market pricing across multiple seasons, particularly when comparing midweek fixtures to weekend slots where travel and work commitments affect turnout.
Attendance Patterns Across English Competitions
Premier League grounds regularly fill to 95 percent capacity or higher during peak periods, yet October 2026 saw several clubs report dips tied to fixture congestion and international breaks, with average gates dropping by 8 percent compared to the prior month according to league compiled statistics. Championship sides meanwhile post more variable numbers, often between 15,000 and 25,000, and betting lines reflect these differences through tighter spreads on home favourites when crowds exceed seasonal norms. Lower league matches demonstrate even wider swings, where sparse attendance below 5,000 spectators frequently coincides with higher scoring outputs and increased volatility in both teams to score markets.
How Bookmakers Incorporate Crowd Metrics
Oddsmakers integrate attendance forecasts into models that weigh home advantage coefficients, drawing from datasets spanning five or more seasons to refine probabilities before lines reach the public. When projected gates rise above established thresholds, home win odds shorten by fractions that accumulate across accumulators, whereas reduced expectations prompt slight lengthening in away team prices. This process draws on real time updates from club ticketing systems and weather reports that influence walk up sales, creating adjustments visible in early market movements each week.
Statistical Correlations and Market Reactions
Studies from European football databases reveal that each additional 10,000 spectators at a match associates with a 3 to 5 percent lift in home team expected goals, a figure that translates directly into implied probabilities used by pricing teams. In October 2026, several high profile fixtures demonstrated this link when unexpected rain reduced attendance by 12 percent and produced corresponding drifts toward draws in live betting exchanges. Observers tracking these movements point to similar patterns in prior campaigns where crowd density influenced referee decisions on marginal calls, though quantitative models focus primarily on outcome distributions rather than individual incidents.
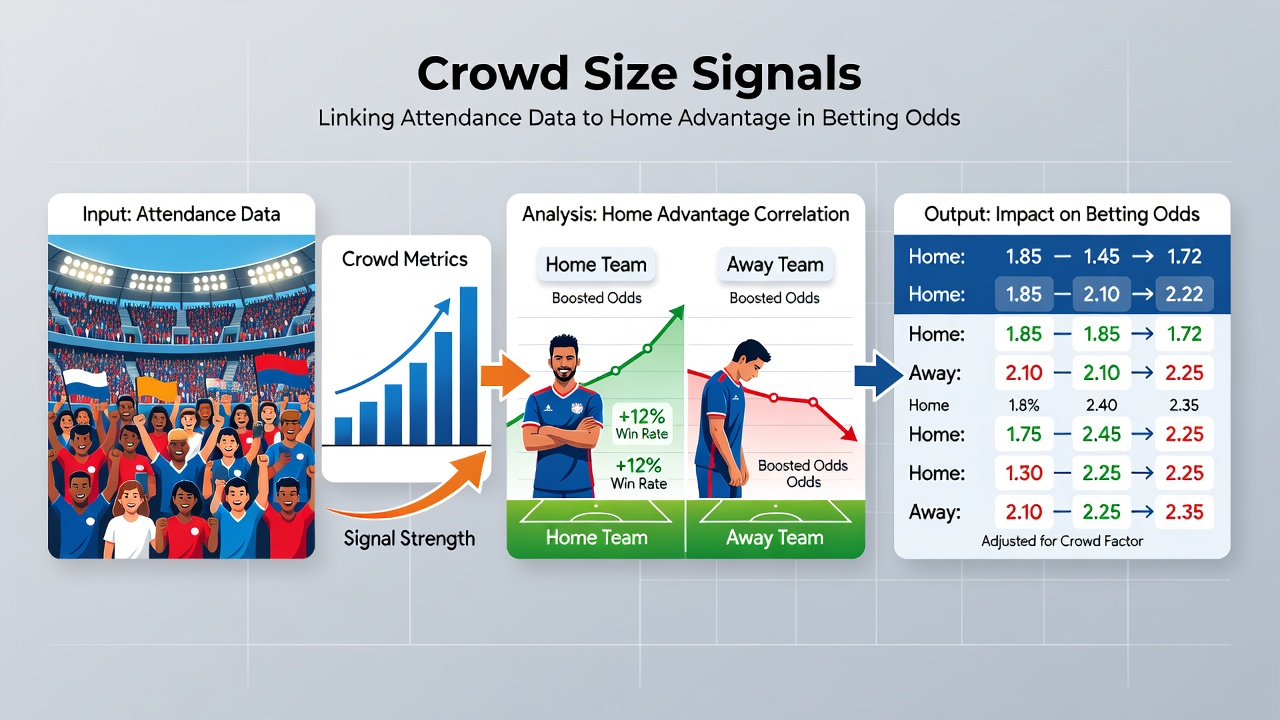
One dataset compiled across 1,200 Championship matches found that home sides with above average support converted 42 percent of their shots on target compared to 37 percent in low attendance games, a difference reflected in pre match totals lines. Bettors monitoring these signals often cross reference official club announcements with historical benchmarks to anticipate line movements, particularly in markets where bookmakers lag behind emerging attendance data released 48 hours before kickoff.
Regional and Seasonal Variations in 2026
Northern clubs tend to maintain steadier attendance regardless of form, while southern venues show greater sensitivity to midweek scheduling that affects working supporters. During the opening weeks of October 2026, data indicated a 15 percent attendance premium for teams returning from European ties compared to domestic only schedules, prompting modest shifts in handicap markets. Australian sports analytics groups have examined parallel trends in their domestic leagues and reached comparable conclusions about crowd density effects, offering additional context for English market participants who follow cross code methodologies.
Practical Applications for Market Analysis
Traders and analysts routinely layer attendance projections onto existing form and injury models to isolate edges where public perception undervalues the home factor. When early ticket sales exceed expectations by 20 percent or more, historical evidence shows home win rates climb sufficiently to justify tightening spreads before kickoff. Conversely, persistent undersells in certain stadiums create repeatable patterns that appear in overs and unders pricing as well as clean sheet markets. A report issued by the European Commission on sport economics highlights how such environmental variables contribute measurable variance across professional leagues without attributing causation to any single element.
Conclusion
Attendance data continues to function as a quantifiable input that refines home advantage assessments within football betting frameworks, supported by multi season records from English competitions and corroborated by parallel findings in other markets. As October 2026 progressed, ongoing collection of gate figures provided fresh material for these models, allowing lines to reflect current conditions more precisely than static historical averages alone. Those monitoring the intersection of physical crowds and numerical odds gain access to layered context that evolves with each round of fixtures.